I’ll admit, when I first took the time to dive into Facebook Analytics, I scrunched up my face and thought, “Ugh, another platform to learn. Maybe later.”
I started digging into it earlier this year, and presented on it at HeroConf in Austin a few weeks ago, because I’ve really come to appreciate the data it gives you. However, I have found repeatedly there’s one stumbling block to getting it going right:
Understanding how to connect the dots to get the best data in there to begin with.
Brace yourselves: It’s not user friendly. I know, you’re shocked, because everything else in Facebook Ads is so self-explanatory.

So let’s dive right into this issue, so you can connect things like a boss and start playing around with the data for yourself.
What are Event Source Groups?
Facebook Analytics allows you to link together the properties you have available so you can analyze them together. By default, if you look in Facebook Analytics, it will show you data related to the pixel. While of course that’s useful, it is information that’s kinda in a silo. The power lies in knowing how that pixel data from your website can show specific behaviors based on people’s off-site behavior, like Page behavior, Messenger behavior, etc.
ESGs (Event Source Groups) tell Facebook which things to group together so it can analyze across the different pieces. So you are telling it “Hey, this page and this pixel are related” or “This app and this page are related.”
The thing is, they don’t really make this clear, and it’s even less clear how to create them.
Where are these things?
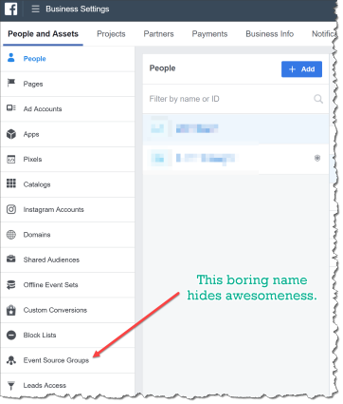
An ESG lives just like any other Facebook asset you have, such as a Page or an Ad Account. You can find it in Business Settings, just like any of those other things:
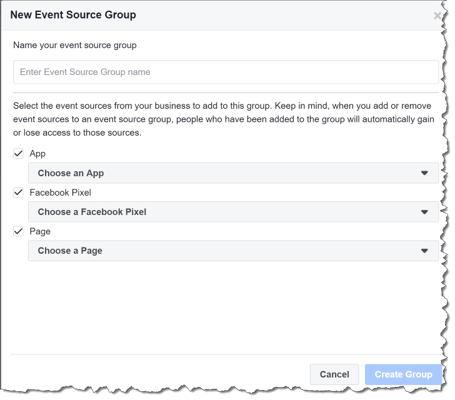
When you open it and create a new one, you can see the available assets, which will populate automatically in the dropdown:
The problem child I keep running into is the part for choosing the Facebook pixel. Up until now, pixels just existed in the ad accounts, and that was basically where they lived. They weren’t used for any exterior thing…but guess what?
They are ALSO an asset just like an ad account or a page. And, like those things, they have separate permissions that have to be granted for you to do anything with them. So when you look at this list, and try to choose a Facebook pixel, you might be miffed to see the one tied to the ad account you care about isn’t there. This was the problem I was beating my head against the wall over, because when I’d got to the pixel and click “Share,” it would just kick me back out into the main Business area again.
But I finally figured it out, so I’m here to save you the frustration since I REALLY want you to use Facebook Analytics!
How to Share the Pixel
- Go into the Business account that owns the Pixel. Click on “Pixels” in the left hand margin:
![]()
2. Click on the pixel you’re wanting to work with, and choose “Assign Partner.”
![]()
3. Drop in your Business Account ID and save.
4. Go back in to your own Business Account, head to Pixels again, and you should see it there – do NOT forget to assign yourself to it.
![]()
Now you can create your ESG the way I showed you in the beginning, and the Pixel will be there.
Using Funnels in Facebook Analytics
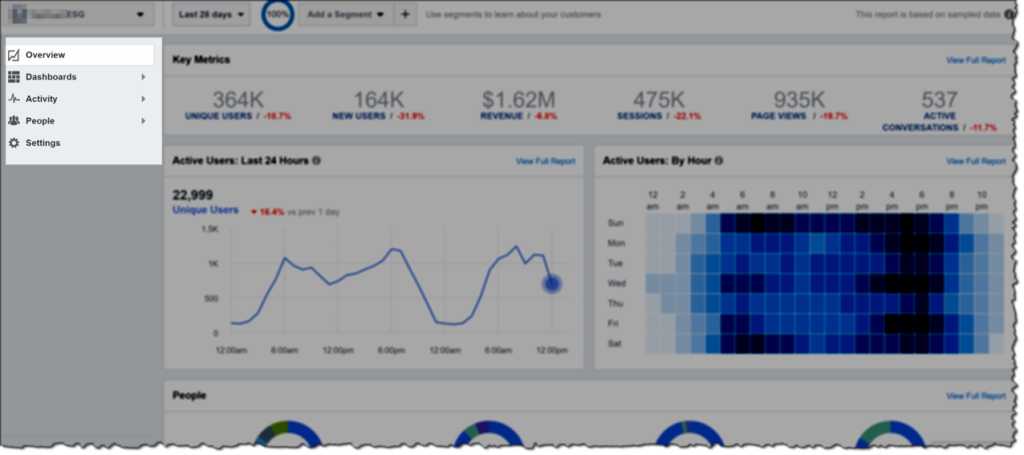
Direct your attention to the left-hand margin – that’s where the good stuff is. The default dashboard, while interesting, isn’t particularly actionable.
The Funnels section is where I spend most of my time for clients. It gives a great opportunity to see how different audience segments behave based on steps they have taken. For accounts I manage that have rich social proof and ad interaction, I LOVE to look at people who comment and see if there are any patterns as to whether they purchase:
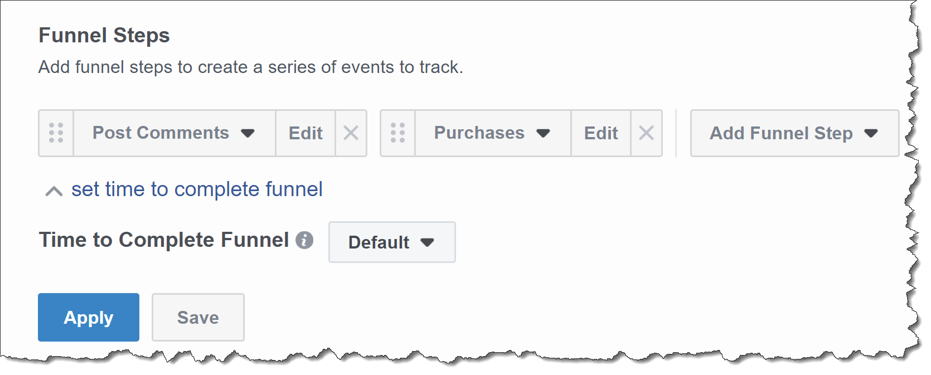
Choosing those in an account gives me this:
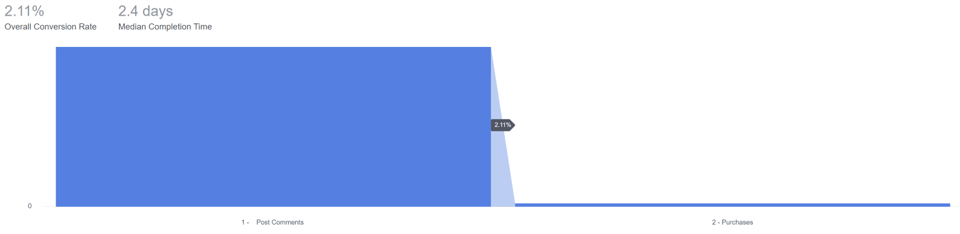
Insights like this may not seem like a boondoggle on the surface, but think of it from a larger strategy perspective: if social interaction means a propensity to then purchase…maybe a post engagement campaign is worthwhile, no? When you then look at purchase value from this funnel, you see this:
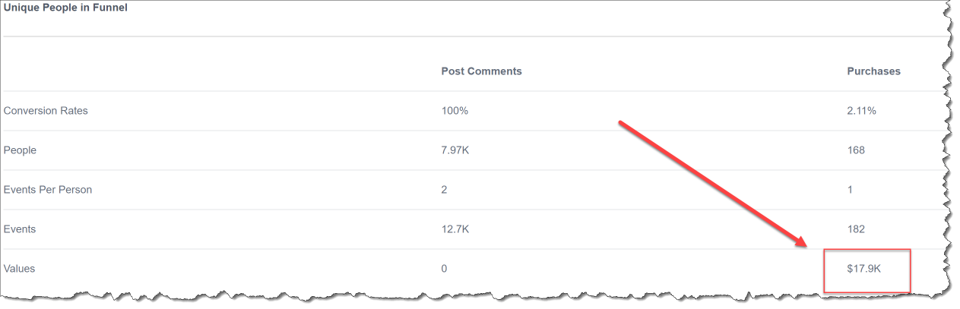
This alone prompted us to up our game on an engagement funnel: We ramped up our Post Engagement campaign strategy, and broke out specific remarketing messaging for users who interacted with a post or ad. Our relevance scores went even higher, and sales volume increased by 13% at the same or less ROAS that we experienced in conversion campaigns. Not a bad win!
Examining User Retention in Facebook Analytics
Another really useful one I use a lot for clients is the Retention analysis. You can uncover some really interesting data that shows the larger life cycle tendencies that aren’t obvious when you just look at sales for the past couple weeks.
Here’s an example when looking at first-time buyers for a product geared toward men:
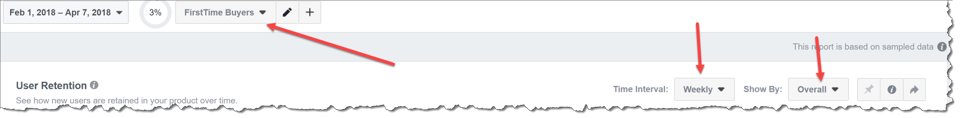
We knew that older men were more likely to buy, but we were curious if the ongoing brand enthusiasm/interaction was any different in the ages. For example, if the younger demographic bought less compared to the older but stayed more engaged, we could create some LTV strategies around those age groups.
Here was what the retention breakdown looked like for 18-24. The top numbers are the months since the purchase took place, with the months down the left showing the month the purchase took place.
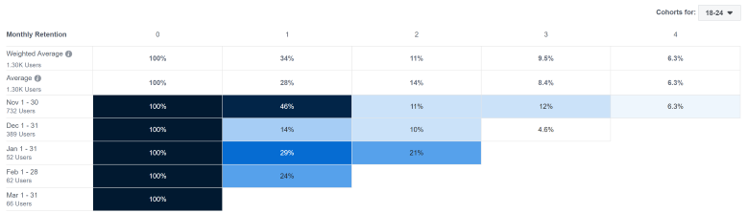
As you can see, retention remained high in month one, with drop-off in month two, and then it was negligible by 3-4 months out. We were especially interested in this time frame because it was gifting season, and we wanted to do a gut check on audience behavior during that stretch vs. customers that are acquired in the spring.
Compare that to the 55-64 crowd:
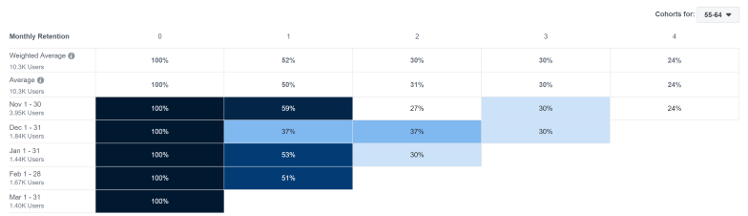
By three months out, there was still a 30% retention rate, and still at 24% by 4 months. Strikingly different than the single-digit retention for those same months in the younger demo.
That’s Just the Beginning
There are really some amazing funnels you can put together as you get more advanced in the ways you leverage Facebook ads. One of the hardest things for us as marketers to do is quantify what things like a comment, a Page like, or a Messenger engagement are worth to a business. The ability to see these types of data patterns in Facebook Analytics not only helps confirm assumptions, but it can uncover new data that changes the direction of where and how you spend your money! I have an excellent example of how one instance launched a whole chatbot strategy for a client that I will share in an upcoming lesson on chatbot strategies. Stay tuned for that!